Chart Program
Store the following values in a JSON array in JavaScript.
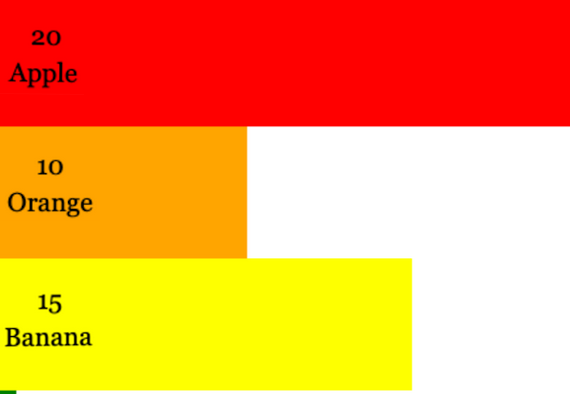
Apple: 20
Orange: 10
Banana: 15
Kiwi:5
Blueberry: 5
Grapes:10
JSON in JavaScript example is best. Here it is partially, to help start you off.
var fruit = [
	{name:"Apple", quantity:20, color:"red"},
	{name:"Orange", quantity:10, color:"orange"}
];
Using Javascript/Canvas, draw out a bar chart showing the quantity in sales for the fruit. Each bar must be in a color that matches the fruit, please choose a unique color for each fruit. You should write the code using HTML5 drawing commands. Later on in the semester we will use a charting library.
Write the name of the fruit, followed by a horizontal bar chart.
Refer to the following examples for help:
https://www.w3schools.com/js/js_json_arrays.asp
http://www.sci.brooklyn.cuny.edu/~goetz/cisc3610/html5/canvas-text-advanced.html
https://www.w3schools.com/tags/canvas_fillstyle.asp
Place it on your portfolio in a section called Labs.