The Column Method to
Drawing A Decision Tree, In 5 Easy Steps.
Step 1: Identify the decisions
Step 2: Draw 2 columns for each decision
Step 3: Label the odd columns with the decisions, in the order identified.
Step 4: Label the even columns with "Possible Outcomes"
Step 5: Add one more column to the end, label "Results"
So given THIS EXAMPLE, it will look like this
Step 1: Identify the decisions
1) Pilot Plant (Y/N)
2) Facility (Y/N)
Step 2 - 5: Draw the columns and label them
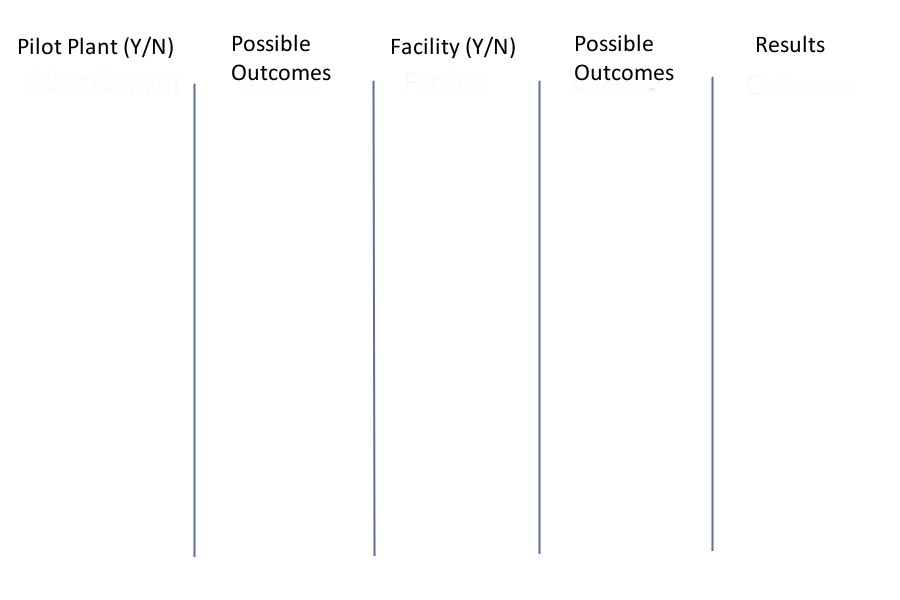
Now that I got the columns, what's next?
1. To find out what to do, just look at the column heading
2. Draw squares on decision columns, draw circles on "Possible Outcomes" columns.
Here's an illustration.
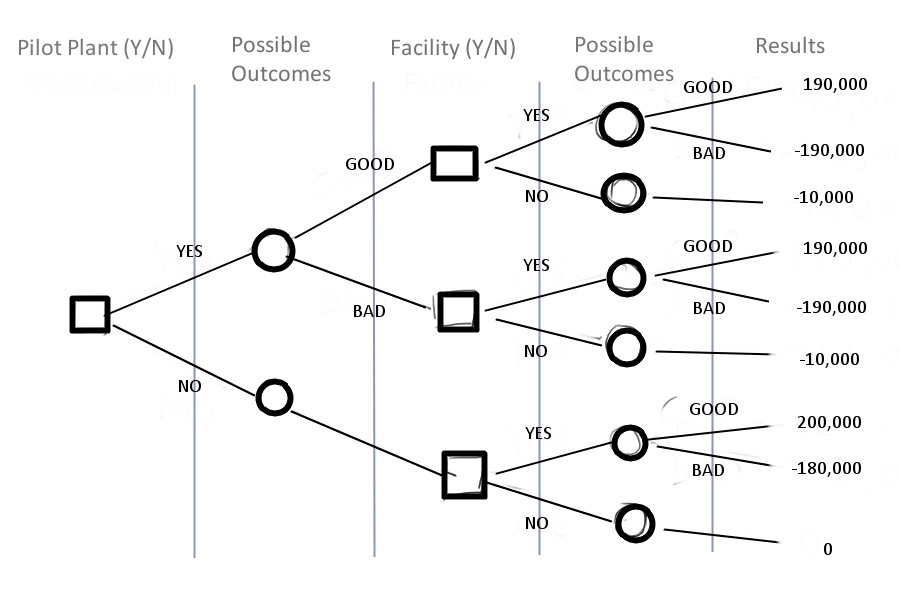
Here's a Step By Step Explanation
Column 1
The column title is "Pilot Plant". It's a decision! Draw a square!
It also has "(Y/N)", what does that mean? Yes or No. So draw 2 line, label Yes and No.
Column 2
The column title is "Possible Outcomes". Draw a circle on each
end!
What are the possible outcomes when we build a pilot plants? 2, Good or Bad. So draw 2 lines, label Good and Bad.
What are the possible outcomes when we don't build? 1. So draw 1 line.
Column 3
The column title is "Facility (Y/N)". It's a decision! Draw a square on each end!
It also has "(Y/N)", what does that mean? Yes or No. So draw 2 lines, label Yes and No.
Column 4
The column title is "Possible Outcomes". Draw a circle on each
end!
What are the possible outcomes when we build a pilot plants? 2, Good or Bad. So draw 2 lines, label Good and Bad.
What are the possible outcomes when we don't build? 1. So draw 1 line.
Column 5
The column title is "Results". So, fill in the results in each case.